Manufacturing Intelligence Platform
An end-to-end manufacturing analytics platform that turns seeded synthetic assembly-line records into executive visibility: OEE, output loss, defect propagation, shift repair gaps, reliability trends, and validation proof.
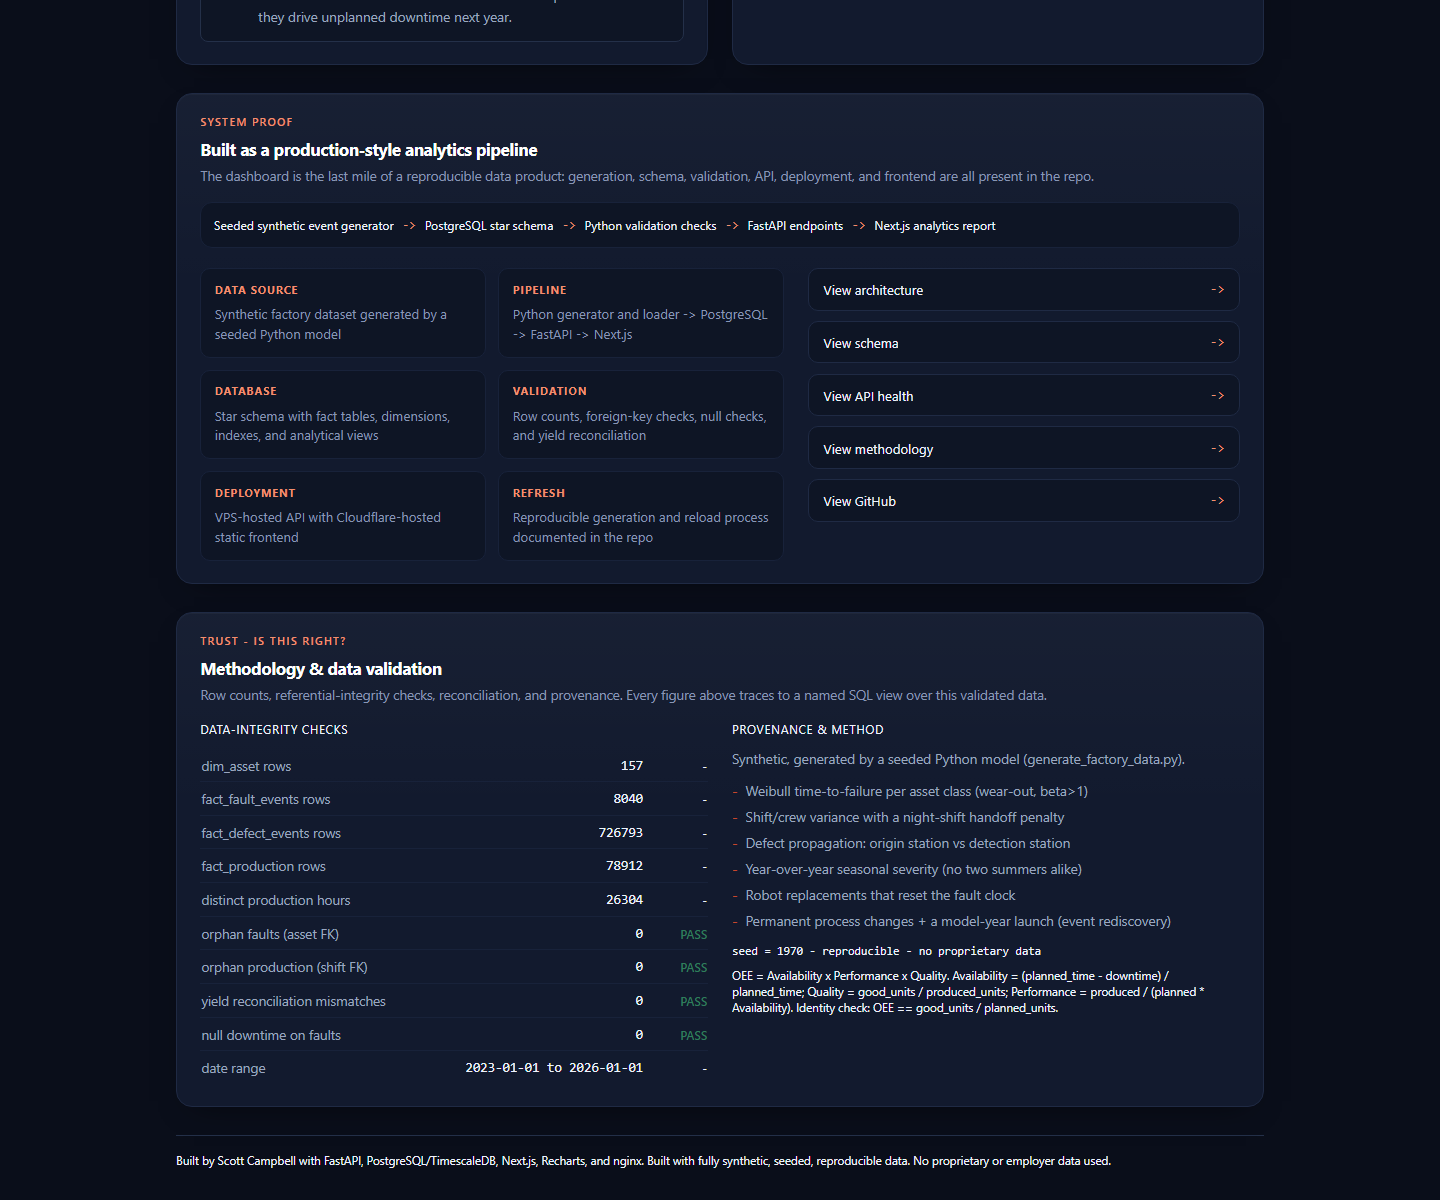
Evidence
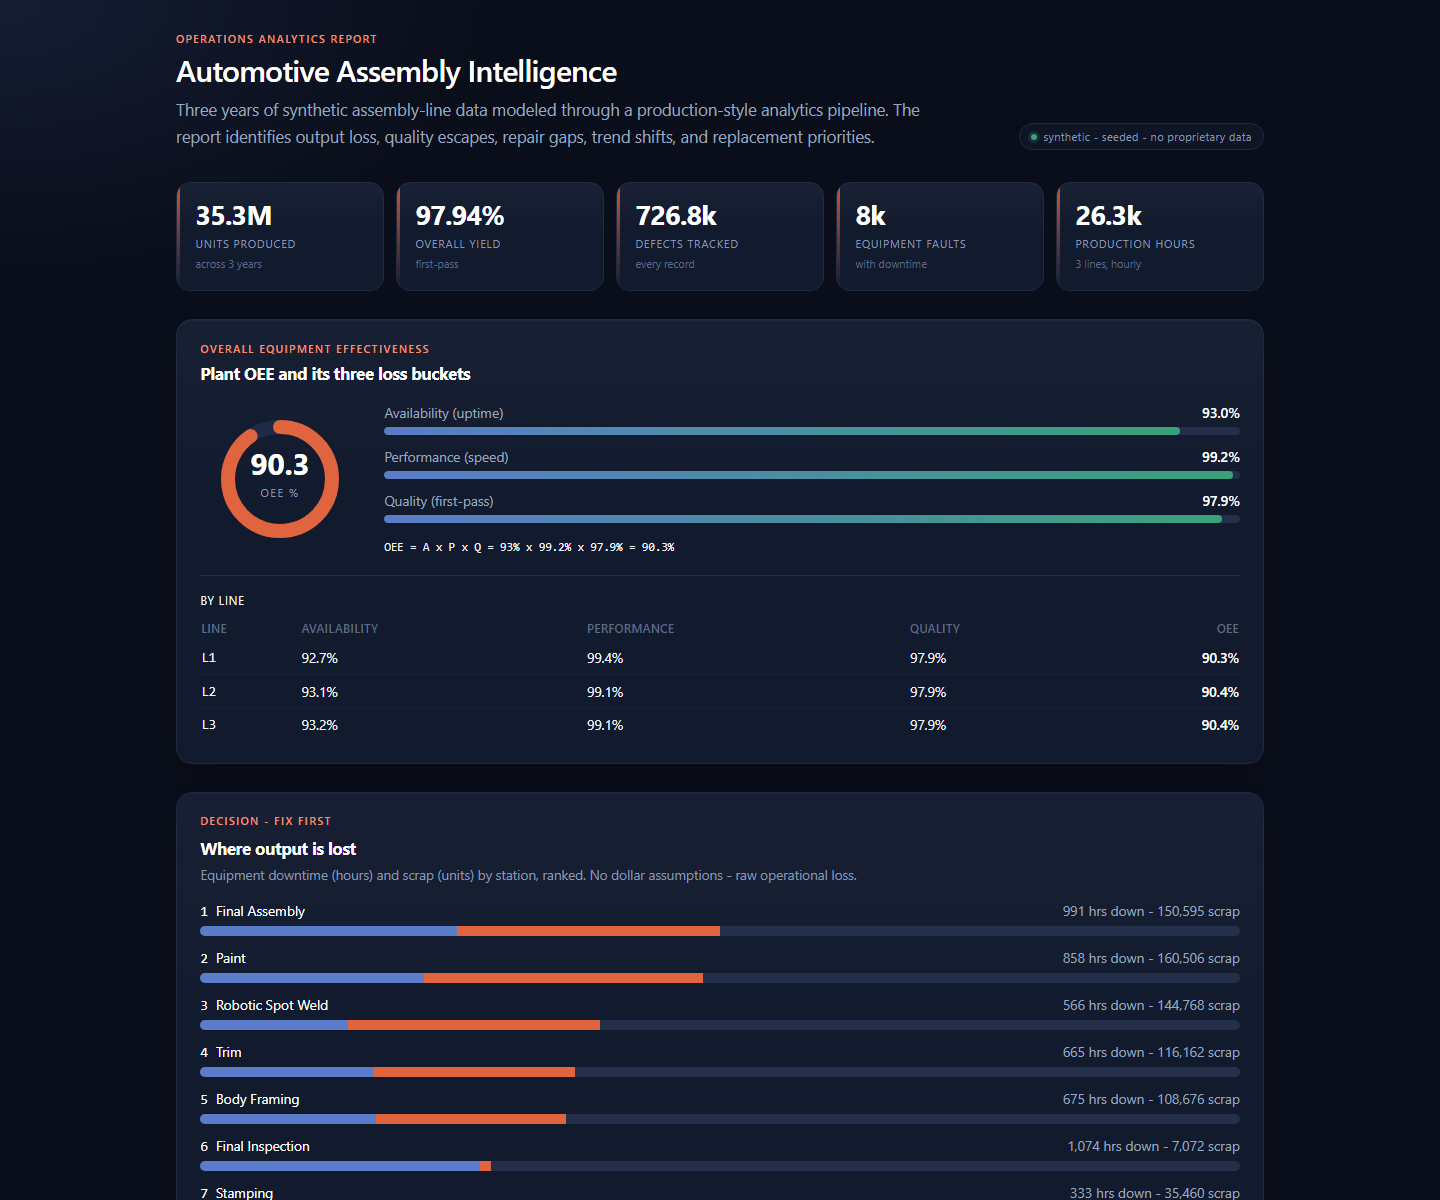
Screenshots from the live dashboard showing the executive report, operational loss analysis, quality propagation, reliability planning, and data validation.
Problem
Manufacturing leaders need to know where output is being lost, whether quality problems are created upstream or merely detected downstream, and which reliability issues deserve capital planning. Raw logs do not answer those questions on their own.
The goal was to build a portfolio-safe factory analytics system that feels like a production data product while using only synthetic, seeded, reproducible data.
Users or audience
The primary audience is recruiters, hiring managers, and technical interviewers evaluating data engineering, SQL modeling, BI delivery, analytical storytelling, and production-style deployment judgment.
The dashboard is designed for an executive operations review: fast enough to scan, detailed enough to defend, and explicit about the data generation and validation behind every metric.
Solution
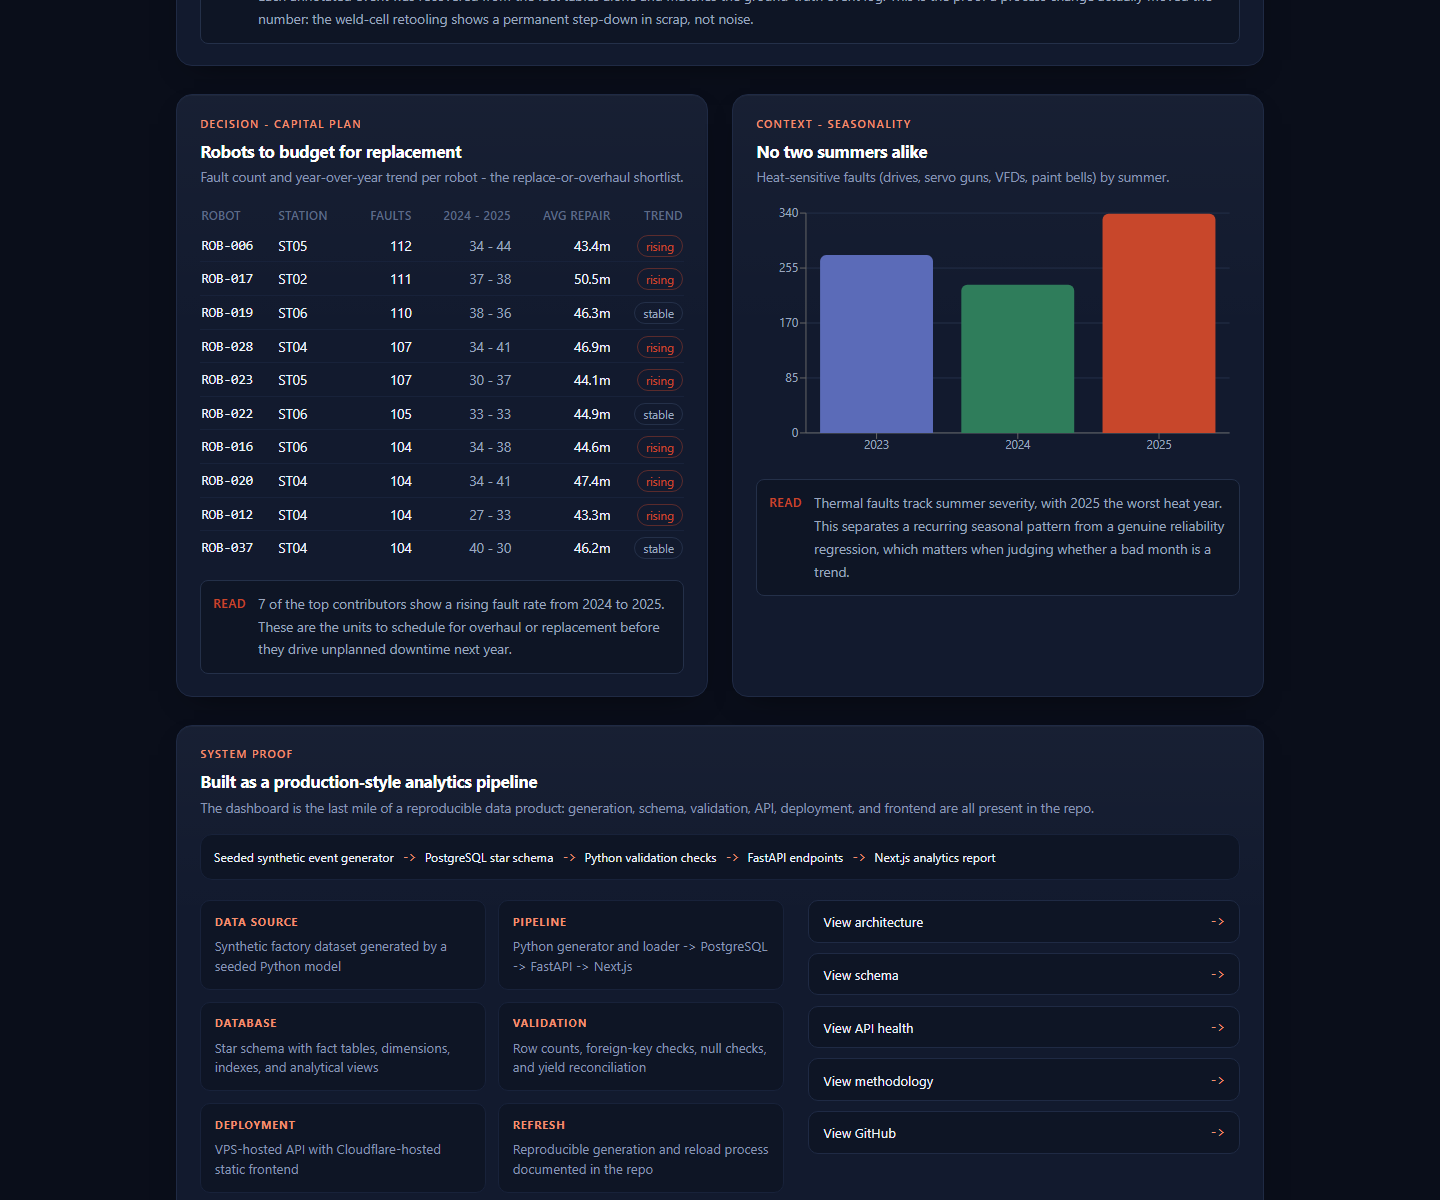
I built a seeded factory data generator, loaded the resulting events into a PostgreSQL star schema, created analytical SQL views, served the data through FastAPI, and published a Next.js report at the live factory domain.
The report moves from plant health to action: OEE decomposition, ranked station loss, crew repair variance, defect origin versus detection, event rediscovery, robot replacement candidates, seasonal reliability context, and validation evidence.
Architecture
Data flow
The generator writes reproducible CSV outputs from a fixed seed. A loader creates the database schema, imports the facts and dimensions, and applies validation checks before the API exposes the reporting views.
The frontend calls the API endpoints directly and presents results as executive metrics, ranked operational lists, trend charts, and trust panels. The same repo documents the generator, schema, backend, frontend, and deployment path.
Tools used
Key features
- Three-year synthetic plant dataset with 35.3M units, 26,304 production hours, 726.8k defect records, and about 8k equipment faults.
- OEE decomposition into availability, performance, and quality.
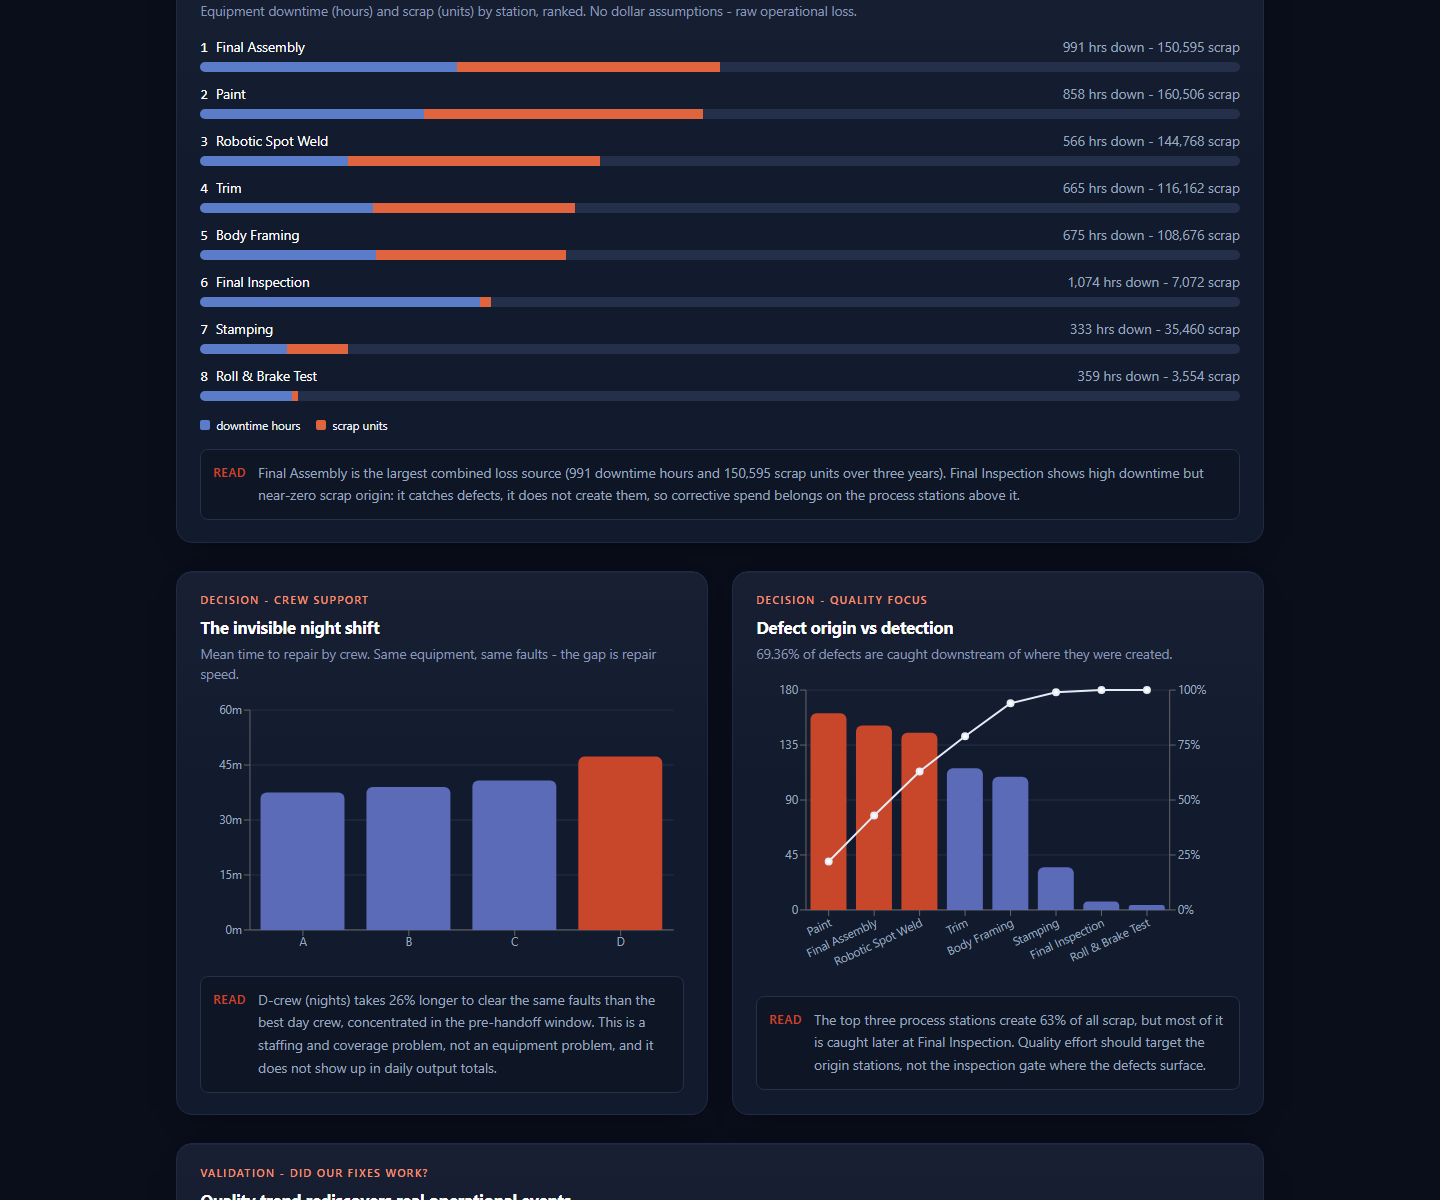
- Ranked station-loss analysis combining downtime hours and scrap units.
- Shift and crew repair-time comparison that surfaces night-shift support gaps.
- Defect origin versus detection analysis to separate where problems are created from where they are found.
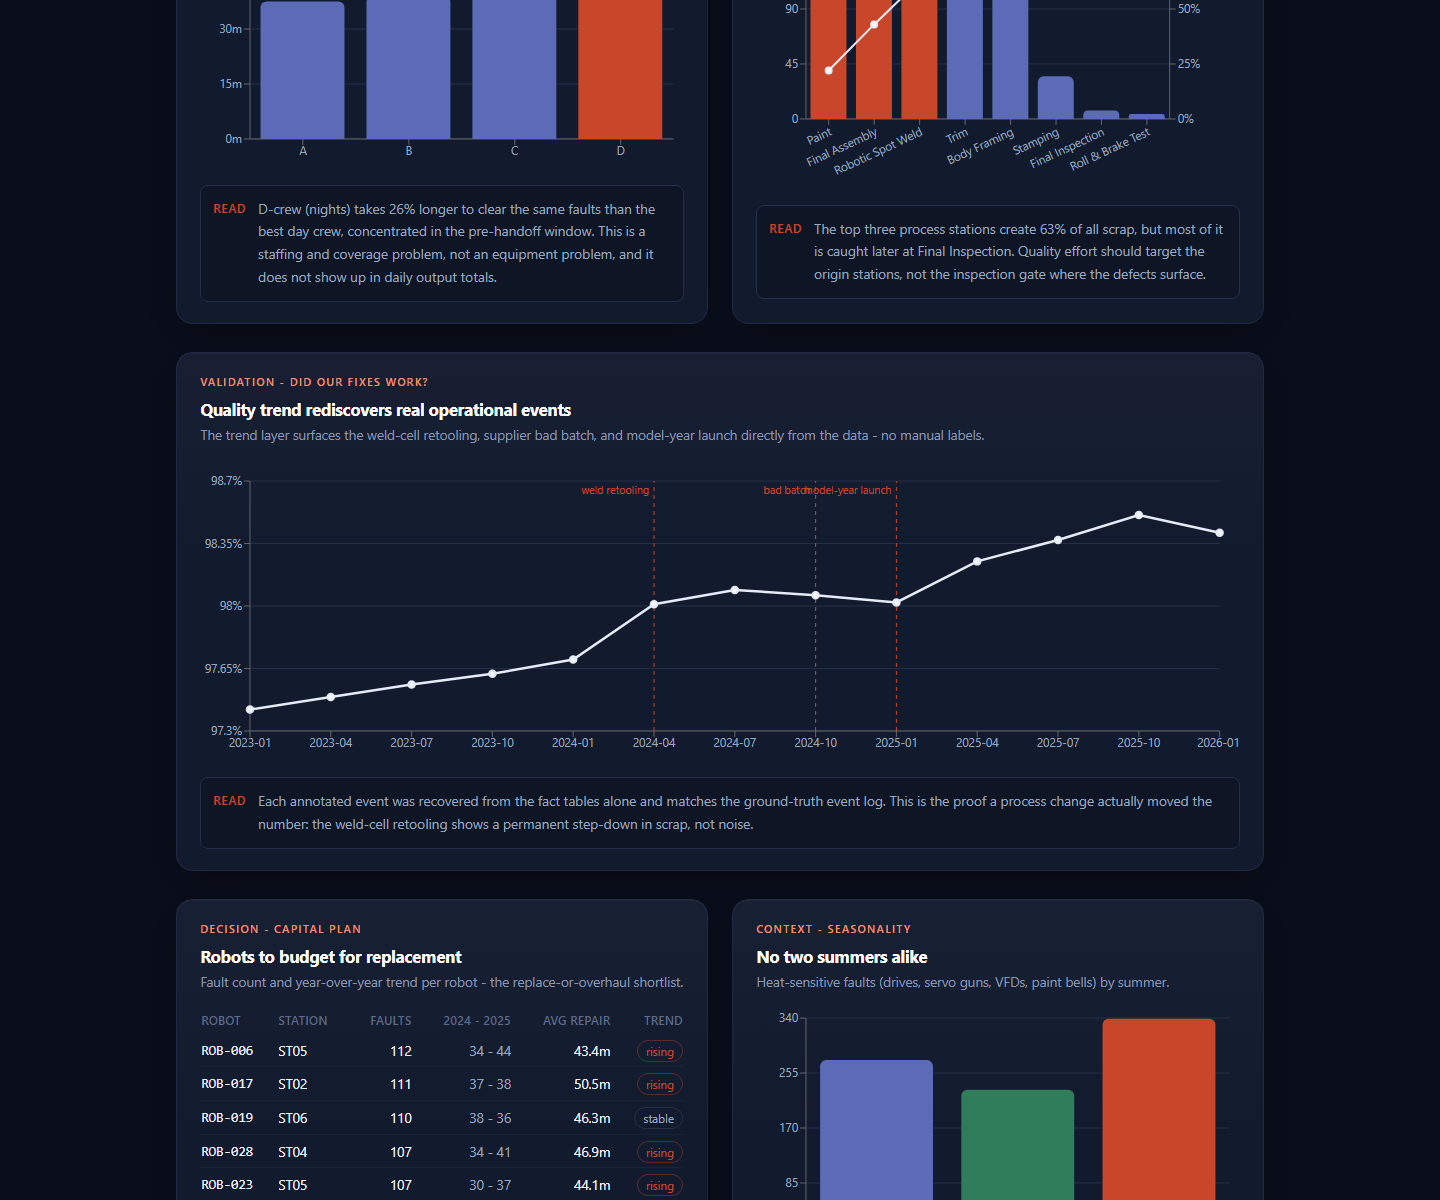
- Reliability view for replacement candidates, year-over-year fault trends, and seasonal fault context.
- Validation and provenance panel showing row counts, foreign-key checks, null checks, date range, and yield reconciliation.
Analytical narrative
The core story is automated trend analysis across a multi-line plant model. The dashboard identifies production bottlenecks before they turn into vague monthly summaries: Final Assembly and Paint dominate combined loss, most defects are detected downstream from where they originate, and one crew has materially slower repair time for the same categories of faults.
The trend layer also checks whether real process changes can be rediscovered from the data. The model surfaces step changes tied to known synthetic events such as weld-cell retooling, a supplier fastener batch issue, a paint-booth upgrade, and a preventive-maintenance program.
Methodology
The dataset is fully synthetic and generated from a seeded Python model. That keeps the project publishable while still allowing realistic manufacturing patterns: wear-out curves, shift variance, defect propagation, seasonal severity, replacement resets, and known events for validation.
The methodology page and API expose provenance and validation checks so the dashboard does not ask viewers to trust polished charts without seeing the data quality layer underneath.
Results or expected value
The platform demonstrates how raw operational logs can become an executive health dashboard with a defensible path from source records to decisions.
Limitations
This is a portfolio demonstration built from synthetic data. It is not a real plant monitoring system and should not be interpreted as real operating performance, safety status, or machine-control logic.
The dashboard emphasizes executive analytics and validation. A production deployment would add authentication, role-based access, real data contracts, observability, incremental loading, and formal data-owner review.
What I would improve next
I would add incremental ingestion, dbt-style model documentation, alerting for emerging bottlenecks, drill-through views from executive charts to source events, and a Power BI companion report for stakeholders who prefer managed BI distribution.