Water System Risk & Funding Priority Index
An explainable public-data screening system for prioritizing Ohio public drinking water systems for review using compliance history, enforcement history, vulnerability, drought exposure, funding context, small-system factors, and data quality.
Evidence
Screenshots from the live dashboard and the scored Ohio prototype.
Sample findings
Screening observations taken directly from the scored Ohio prototype. These are signals from public data, not regulatory findings about any individual system.
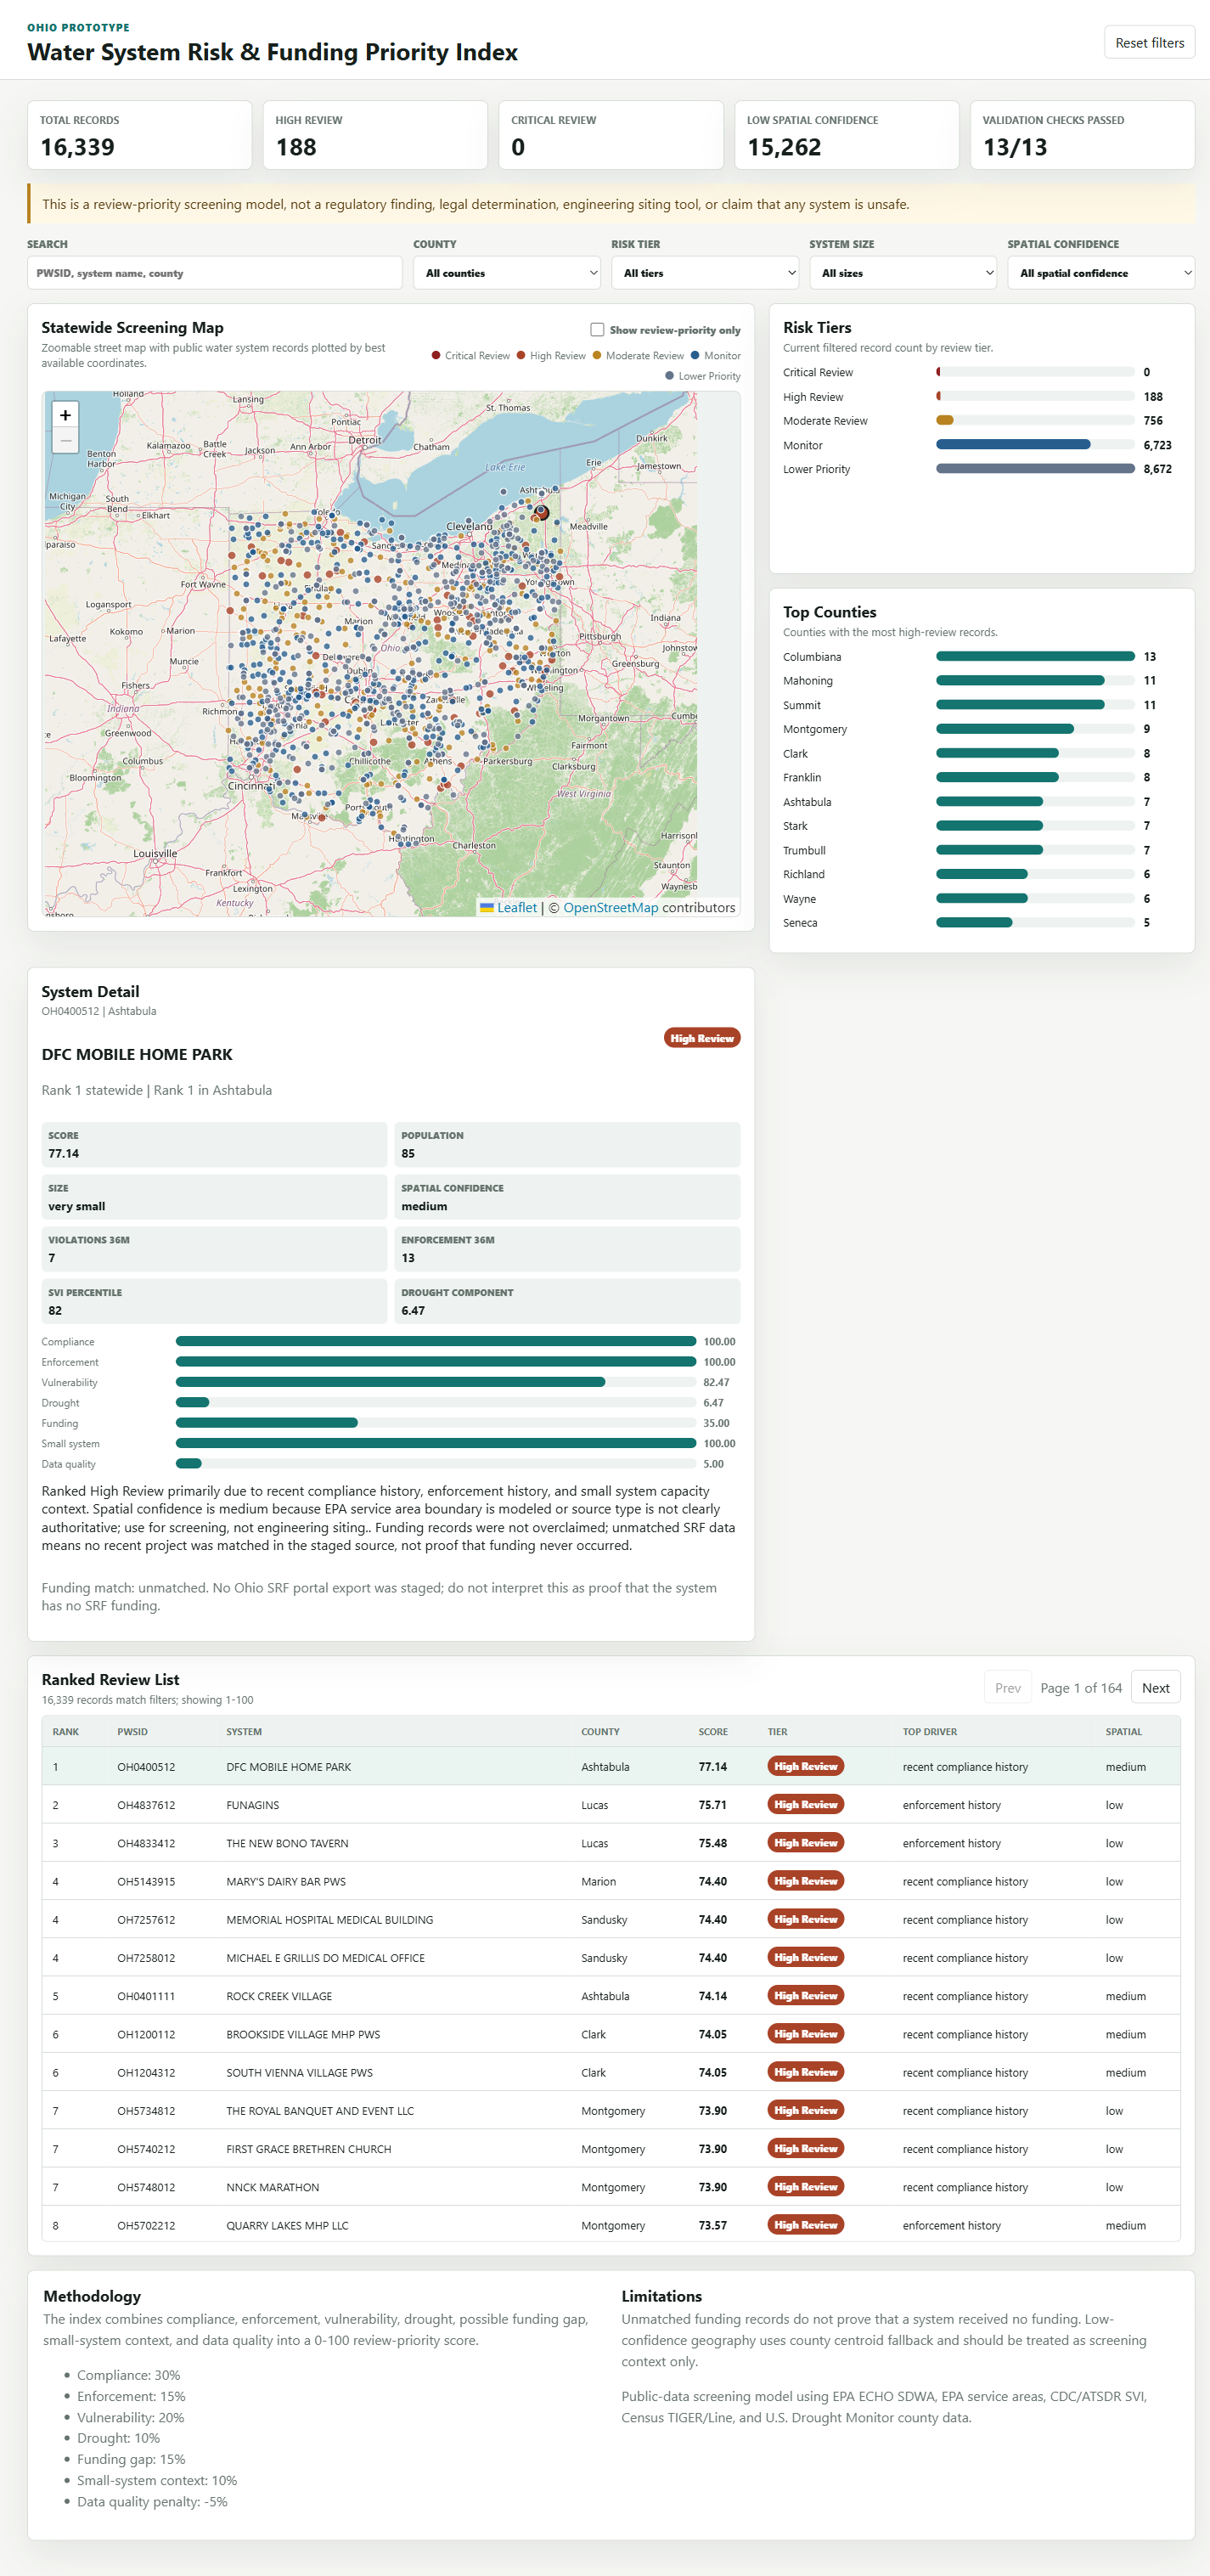
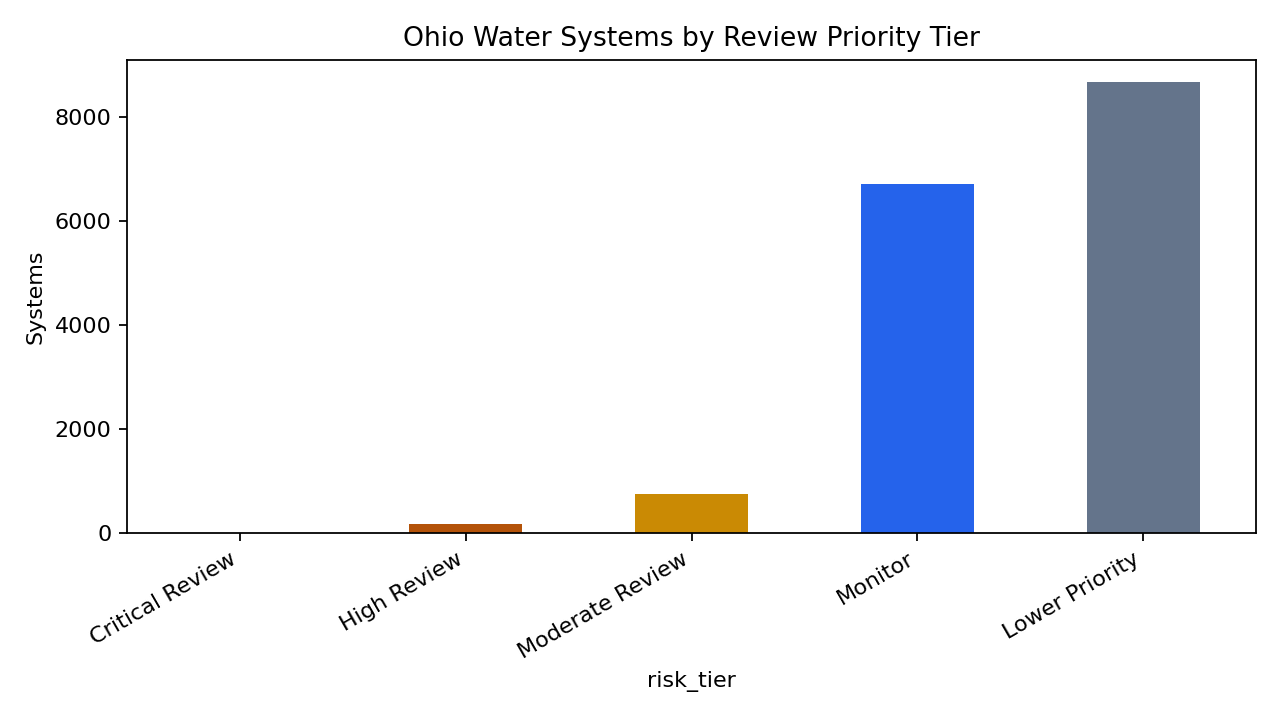
- County concentration. Columbiana County had the largest number of high-review records (13), followed by Mahoning and Summit counties (11 each). High-review records spread across many counties rather than concentrating in a single metro area.
- Size pattern in the highest tiers. Every one of the 188 High Review records was a small, very small, or medium system; no large system reached the High Review tier. Small systems showed the highest high-review rate (2.5%, versus 1.0% for very small and 0% for large), consistent with the focus on smaller systems that often have less staff and grant capacity.
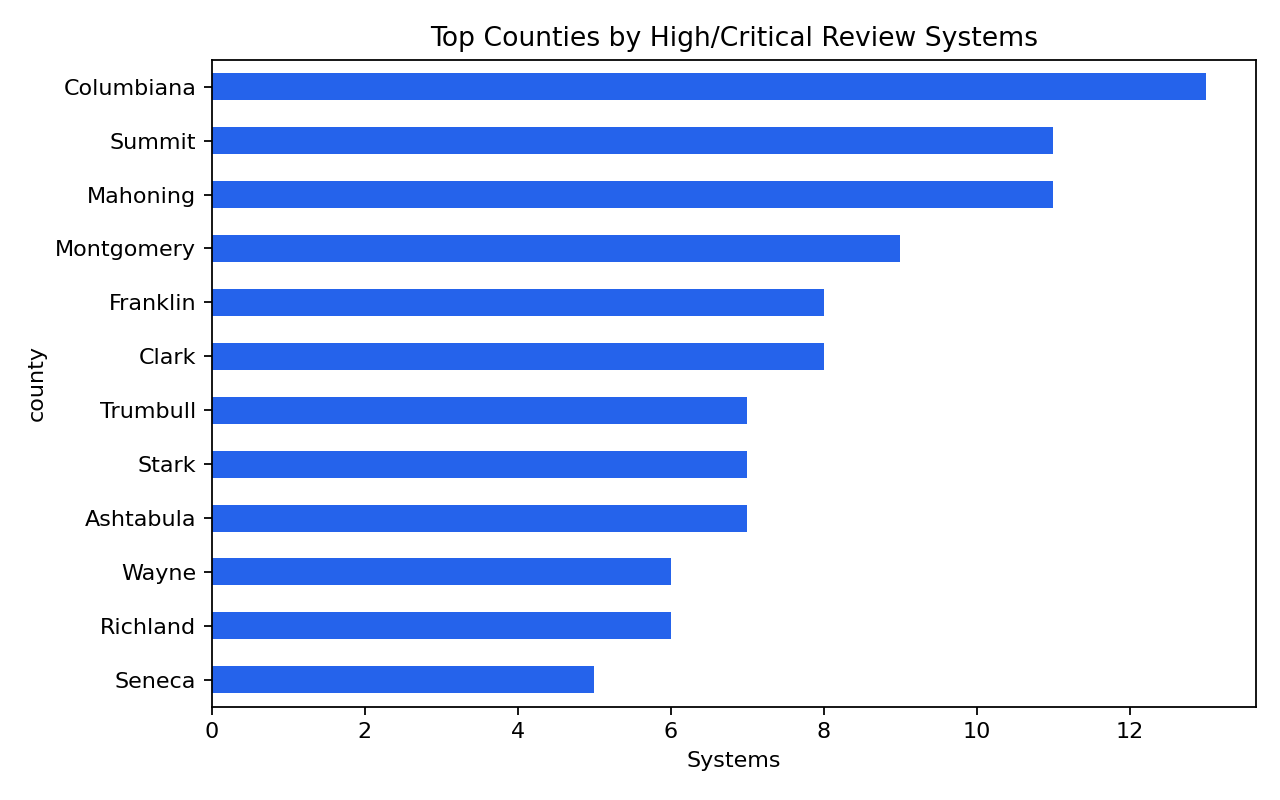
- Geometry source is tracked, not hidden. Only 1,077 of 16,339 records (6.6%) have an EPA service-area polygon (207 system-sourced, 870 modeled); the rest fall back to county centroids or are unmatched and are labeled "Approximate Location." Each record carries an explicit geometry-source tier so modeled or centroid placement is never overinterpreted as a verified service-area boundary.
Problem
Public drinking water data is spread across regulatory downloads, geographic boundaries, vulnerability datasets, drought feeds, and funding records. The signals are useful, but they are not naturally organized into a single review-priority workflow.
The project needed a transparent way to identify which small systems may deserve earlier review for compliance support, technical assistance, infrastructure funding research, or resilience planning while clearly stating what the model can and cannot claim.
Users or audience
The primary audience is recruiters, hiring managers, and technical interviewers evaluating practical data engineering, public-data analytics, explainable scoring, API design, and dashboard delivery.
The dashboard is a portfolio screening model. It is not a regulatory determination, legal finding, engineering siting tool, official risk assessment, or statement that any water system is unsafe.
Solution
The system builds a scored Ohio water-system dataset from public sources, validates the outputs, loads the dashboard data into Postgres, and serves filtered summaries, maps, system lists, and detail views through a FastAPI backend.
The live frontend keeps filtering, sorting, and pagination server-side so the browser only requests the records and aggregates needed for the current view.
Architecture
Data flow
Raw source files are cleaned into consistent water-system, compliance, enforcement, geography, funding, and drought/vulnerability features. The scoring step normalizes each component to a 0-100 scale, applies documented weights, assigns review tiers, and writes validation-ready outputs.
The web export creates an application dataset, the API loader seeds Postgres, and the frontend queries focused endpoints for metadata, summary cards, tier counts, ranked systems, single-system detail, and lightweight map points.
Tools used
Key features
- Scored 16,339 Ohio public water system records.
- Real EPA service-area boundary polygons (1,077 systems) on the map, with a geometry-source hierarchy from system-sourced and modeled boundaries down to county-centroid approximations.
- Transparent weighting for compliance, enforcement, vulnerability, drought, funding gap, small-system context, and data quality.
- Server-side search, filters, sorting, pagination, map points, map boundaries, and detail endpoints.
- Map layer controls and a per-system geography-evidence panel (boundary type, provider, PWSID match, area, confidence, limitations).
- Validation report expanded from 13 to 19 checks (adding geometry-source, boundary dissolve, count reconciliation, and simplification-quality checks) passing before publication.
Tradeoffs and constraints
The model favors transparency and explainability over black-box prediction. That makes the reasoning easier to inspect, but the weights remain analytical assumptions that would need subject-matter review before operational use.
Many systems can be scored from SDWA records, but not every system has high-confidence service-area geometry. The dashboard surfaces spatial confidence so users can distinguish map convenience from verified service-area precision.
Methodology
Appropriate use: portfolio demonstration of public-data engineering, transparent scoring, API-backed dashboard delivery, and limitation-aware analytics.
Inappropriate use: regulatory decisions, legal findings, engineering siting, official safety conclusions, or claims that a specific system is unsafe.
Results or expected value
The finished platform demonstrates the full path from public source data to validated analytical outputs, API delivery, and an interactive dashboard that states its limits clearly.
Limitations
Source data is not real-time. County-level vulnerability and drought context are fallback indicators, not household-level exposure measures. County centroid mapping is suitable for screening only where service-area geometry is unavailable.
Unmatched funding records do not prove a system received no funding, and a high review-priority score is a screening signal rather than a finding about water safety.
What I would improve next
I would add deeper SRF project matching, tract-level SVI where geometry supports it, PostGIS-backed spatial processing for broader scaling, automated refresh checks, and clearer model evaluation once a validated outcome is defined.